
Ran into the above out at CBO 125 Year Picture
The web is so full of information like this is too bad that MSM reporters don't care much about facts. The chart shows spending as related to GDP, a rational approach. We commonly hear about "the largest deficit", "largest budget" or some other version of runaway spending in raw, non-inflation or percentage related numbers. Simply hearing that should be a red-flag that the source is trying to mislead you.
Most everything in the number department really only makes sense in context and relationship. If someone lost 10lbs during a workout, it would certainly be life threatening for a 100lb woman, but a fairly normal thing for an NFL lineman. Looking at numbers as a % of GDP is nice in that the inflation effect and the relationship to the size of the overall country are pretty much factored out, and one is comparing apples to apples over history.
The purpose of the web page is to show that there is no way that the the country can continue to spend on Social Security, Medicare, and Medicaid at the rates that we are now as the baby boom retires. It is a pretty sad commentary that very few Americans understand the chart at the end of this blog. Believing in the Easter Bunny is more rational than believing that we are going to continue on as we currently are with the named programs.
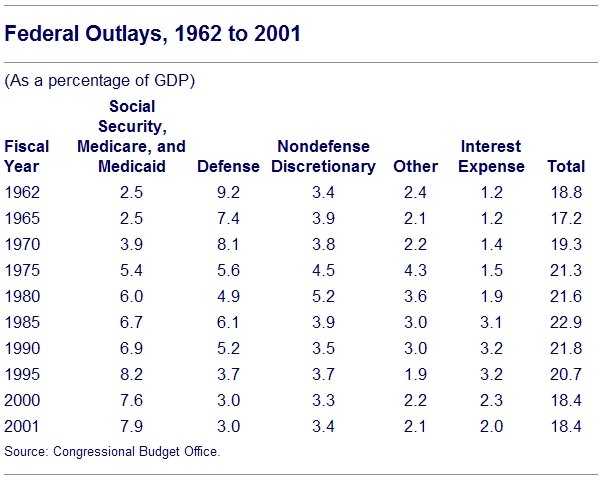
The chart at the start of the blog though shows pretty clearly that GIVEN SOLID ECONOMIC GROWTH, we can do a ton of things with very little effect on the overall economy ... war in Vietnam, War on Poverty, screw up 4 years with truly the worst President in at last a century, Jimmuh, end the USSR, and a host of other things all with something between 17 and 23% of GDP. The chart shows the "lie of defense" that the left likes to blame for everything ... going from 9% to 3% over the period. It shows the seeds of the disaster that awaits us with SS and the Medical entitlements going from 2.5 to 7.9% of an ever larger GDP. Starting in '75 and not beginning to drop off until '85 we see the mini-disaster of the slow growth of the '70s to early 80's. Had that not been turned around, our situation would actually be grim today, rather than just looking grim in the future.
Why the CBO seems to think that crisis isn't going to ensue post 2010, I have no idea. It seems very unlikely to me that all other spending is going to drop from 13-15% to a static 7.1%, and I doubt that interest will become a net revenue GAIN for a significant period. What it DOES show pretty clearly is that the entitlements eat the budget at a rate that is TRULY "unprecedented in history". The Democrats and MSM are very proud that they were able to stop Bush from doing anything about this problem, more proof that nothing makes them happier than what they know will damage the "unfair country" ... America.

No comments:
Post a Comment